|
If you ever had a need to show the details for one section of a hierarchy, but not all, hopefully this post will do the trick. In this example we will use Superstore data to show the Sub-Category details of one Category, but not the other two.
You will need 2 columns, one for the overall Category and one for the details. Your data may already have a column that has a lower grain of data for some records, but not others. A business example could be the"Sales" line is only total sales, but for "Costs" we also have a secondary breakout by Cost of Goods Sold, Marketing Costs and Admin Costs. For Sales we just want to show total sales and for cost we want to show total costs AND the breakouts by cost type. For this example we will use a table, but this also applies to bar charts and other visuals: 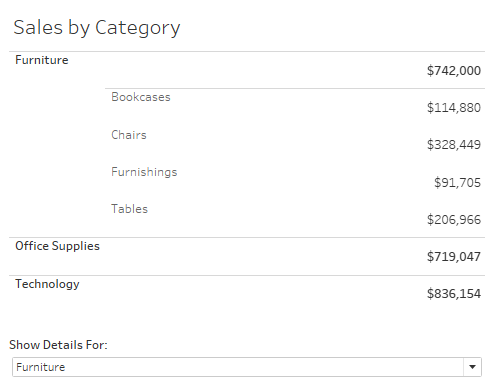
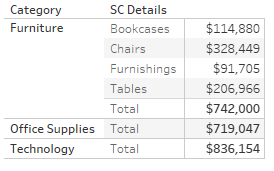
As you can see in the chart above, in addition to showing each Category totals, we show the details for Furniture.
As mentioned above, I created a column in the superstore data that only showed the sub-category based on a parameter. 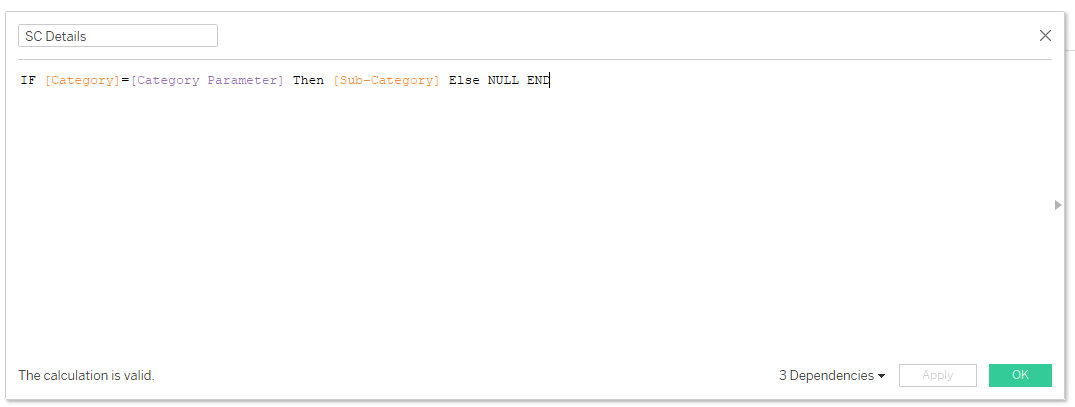
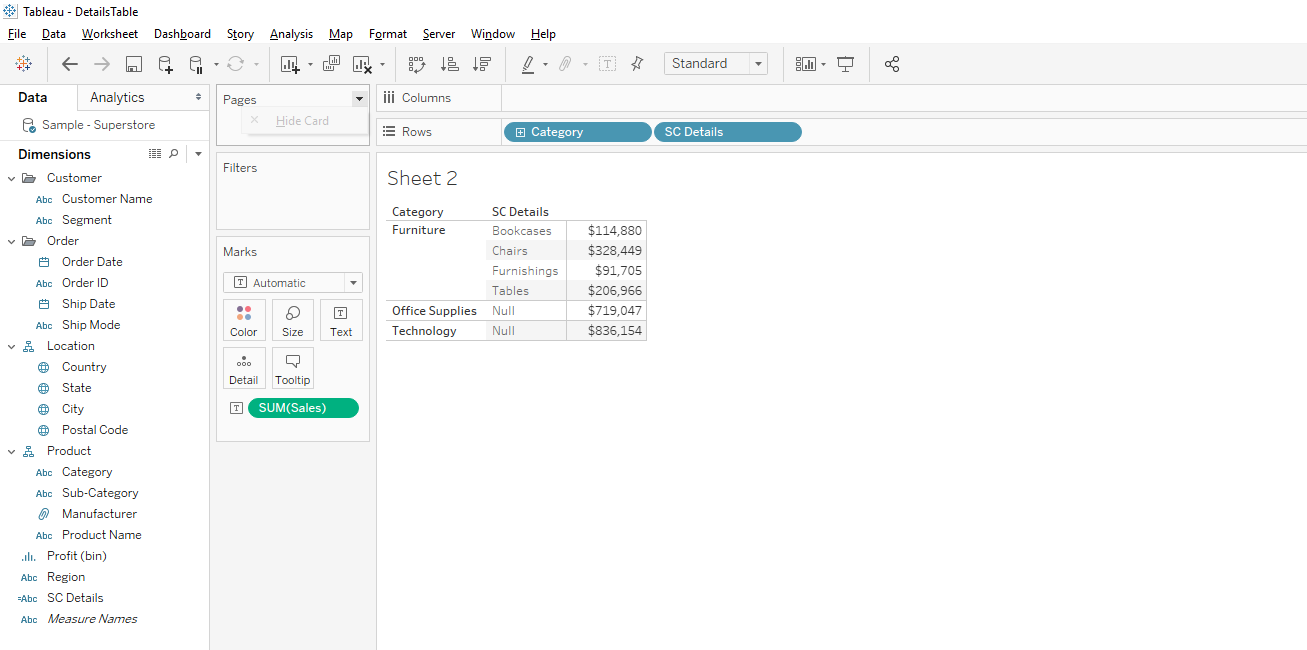
Step 1: Bring the two fields into the view. You will get something that shows the totals for the amounts without any details, and the detailed breakout (without a total) for the other category.
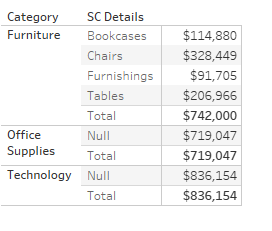
Step 2: Add subtotals to your view. You now have a total amount for each category. Notice, the amounts where there are no details is now unnecessarily duplicated because subtotals are shown for all categories.
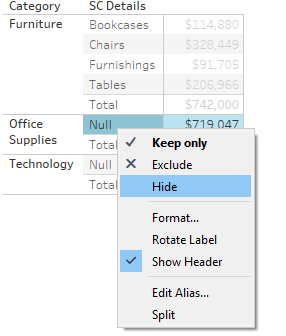
Step 3: Hide the value NULL. This will remove the original data point and only leave to subtotal. While you cannot selectively show / hide subtotals (unfortunately) this will dynamically hide all instances where there are no details in the second column leaving you with the amount shown once.
Step 4: In the Format Pane remove the word "Total" from the label making it blank. This will clear the "Total" label from the second column without details, leaving only the details labeled.
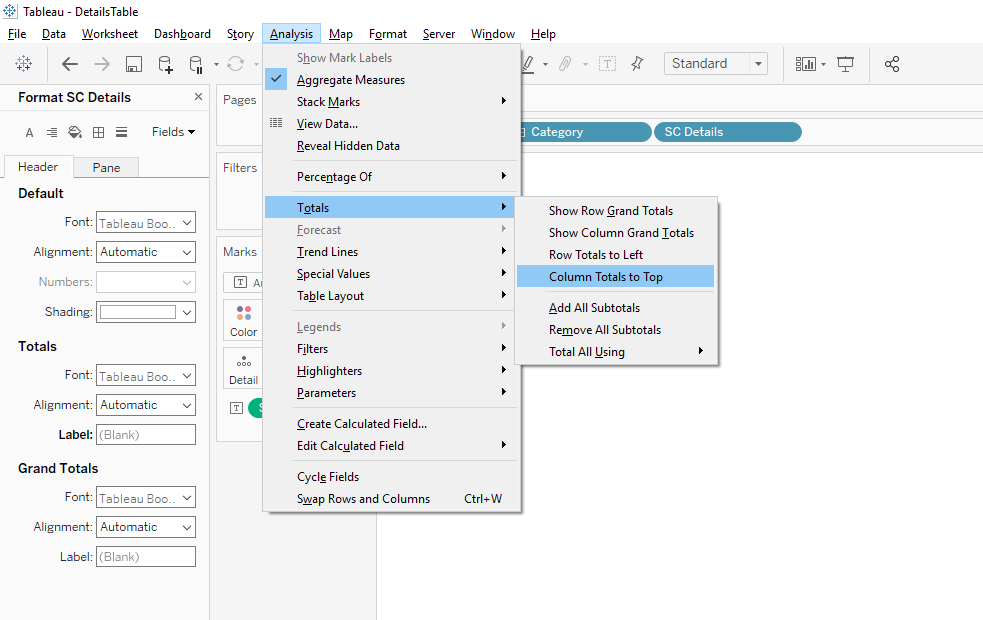
Under Analysis tab at the top, choose to show totals at the top. 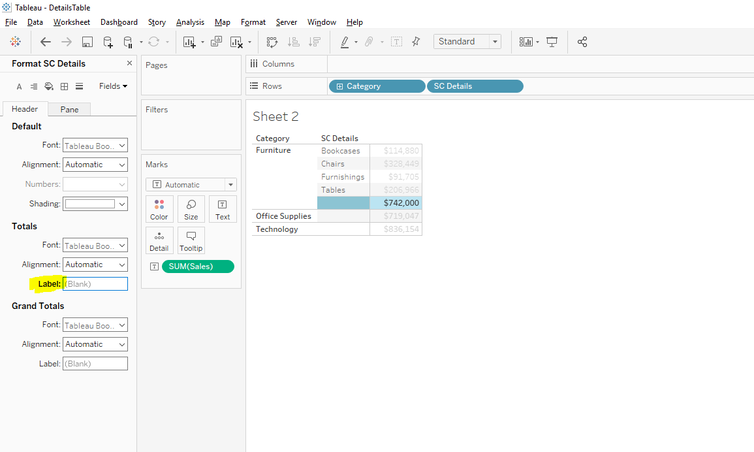
All that is left now is some formatting. I chose to remove row banding, column dividers and left the row dividers. Since all your Category amounts are technically subtotals they will be bold and you can control their format separately from the details.
Thanks for reading! Corey 
2 Comments
Harold Orel
12/18/2018 08:33:33 am
RE: Show Details
Harold Orel
12/18/2018 08:37:57 am
To solve the color issue, Use the 'SC Detail 'field for color.. Leave a Reply. |
AuthorCorey Jones | @coreyj34 Archives
December 2018
Categories |
 RSS Feed
