|
Background: I recently had the idea that I wanted to track the Sixers likelihood to make the playoffs. The original plan was to create a model by testing factors such as strength of schedule (SOS) played, SOS remaining, current record, and others keeping those which were significant. After doing some research I found BasketballReference.com has completed a similar exercise and created an award-winning model. This sparked a new question: could I automatically retrieve what BasketballReference is predicating each day and track how the Sixers’ odds change?
I determined there were three main things that I needed to do:
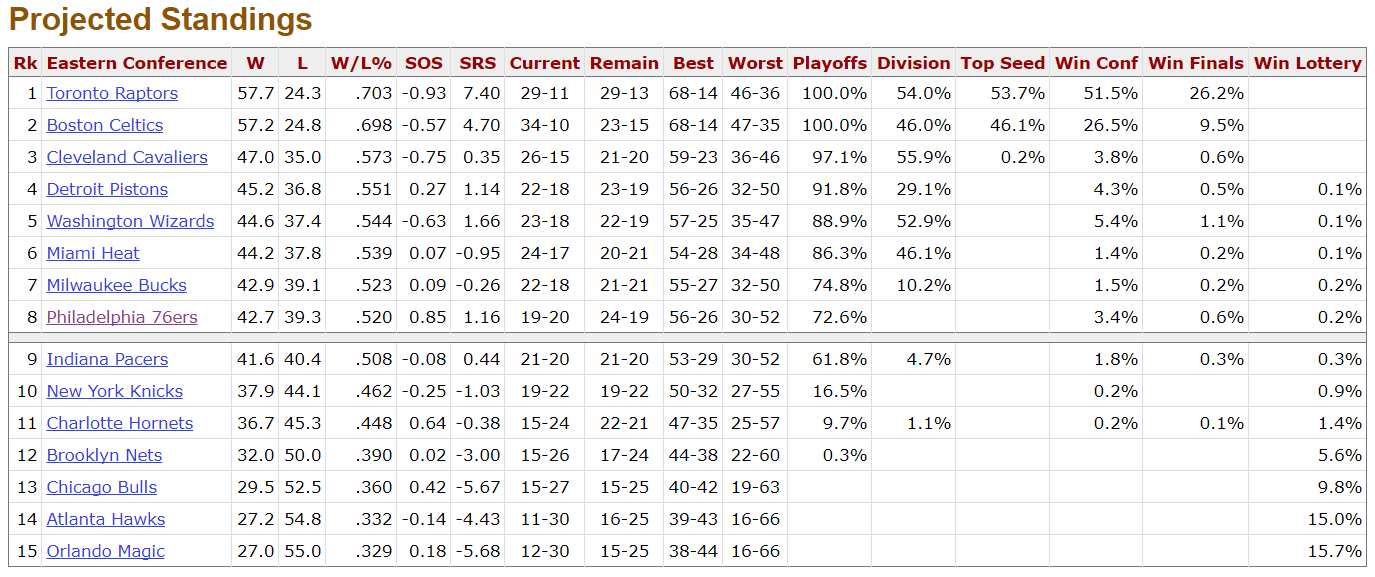
1. Fetching the Data To create something hands-off I knew I would be calling on Google Sheets. I have used the Google’s IMPORTHTML() function in the past so this part was not too bad. Since the table is relatively fixed (there will not be new teams—rows – added) I was able to simply use the function twice to pull the data from the Eastern Conference table and the Western Conference table. =IMPORTHTML("https://www.basketball-reference.com/friv/playoff_prob.html","table",1)
Table 1 from BasketballReference
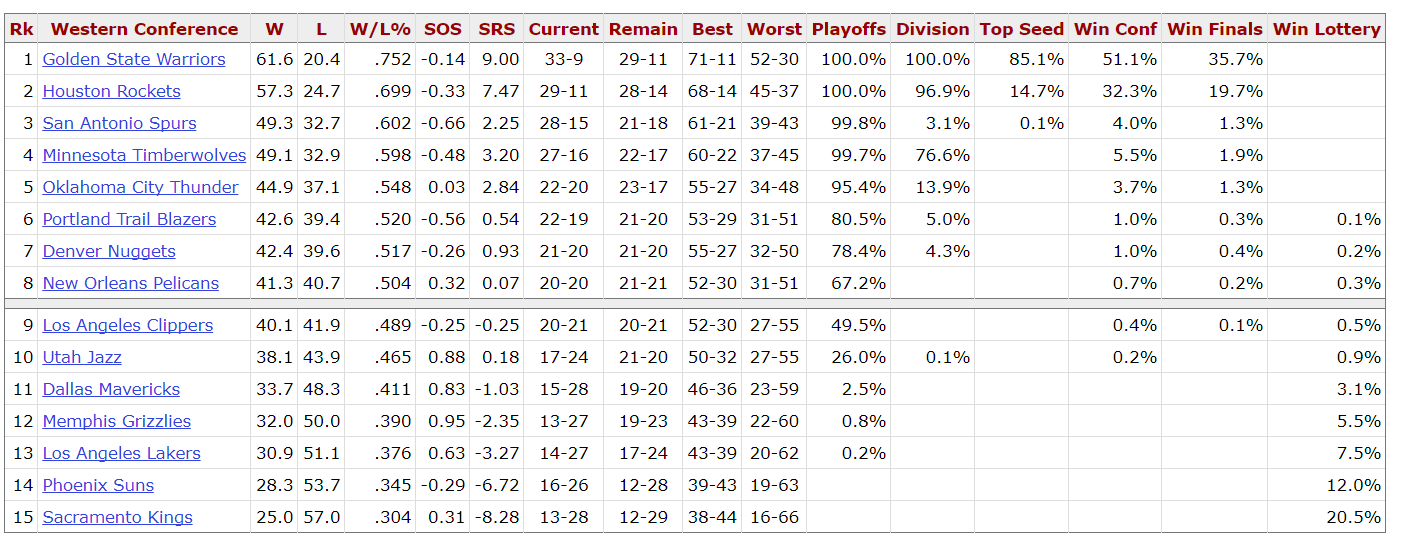
=IMPORTHTML("https://www.basketball-reference.com/friv/playoff_prob.html","table",2)
Table 2 from BasketballReference
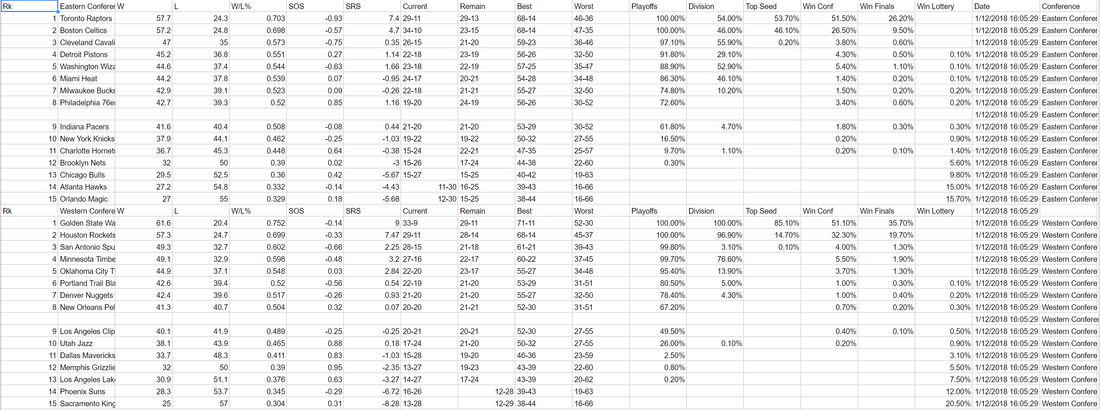
I then added a few additional columns after the table. The one that will be important later was the date and time field. By using the function NOW(), when the data is retrieved there will also be a time stamp.
Data from BasketballReference in Google Sheet using ImportHTML function
2. Archiving the Data Now that I had the data and a timestamp when the data was pulled, I wanted to move this data to a new sheet so that I could add the results each day. Like Excel with macros, Google Sheets has a feature called Script Editor. I was able find a template to get me started by Ben Collins. In this example, he has a single cell returning a value from the web and created a script to copy the value to the bottom of a running list on the same sheet. The basic premise is to use Google Sheets' variable (var) function to define the cells you wish to copy and use the appendRow() function to add the rows to the bottom of a table. The important change I made to the original example was having the result write to a separate sheet than the original data was found. This is achieved by creating two variables, one defining where to source the data (in this case it is called "Sheet") and one to write the final data to (“Final”).
Next simply define which cells need to be copied form the original sheet using the getValue() function. Each new variable will be used in the append rows function to tell Google to copy the value in the reference cell. In the code below, the "sheet" after the equals sign is a reference to the variable we defined above, which allows it to know to get data from the sheet called "Raw" in the workbook.
And with the cells defined, list all your variables from above in the appendRow() function. Note, the final.appendRows is referencing the variable we created above to indicate the data show be placed in the sheet called "Final":
When you run the script, Google Sheets will copy all the values from the specified cells into the next available row in your Final sheet. If you have multiple rows in your source data, like I did, you will need to copy the entire function and change the row number in your script to reference the next row in the Google Sheet (for example change Raw!A2 to Raw!A3. Code Snapshot for one row:
3. Automating the Process
Now let’s make it run by itself. This is fairly easy. We first need to automate the IMPORTHTML function. By creating the following code in the script editor, Google will simply place the what is defined as "cellFunction" in the cells specified (in this case A1 and A18). By placing the function in the cell, it will cause the function to refresh with new data from the site.
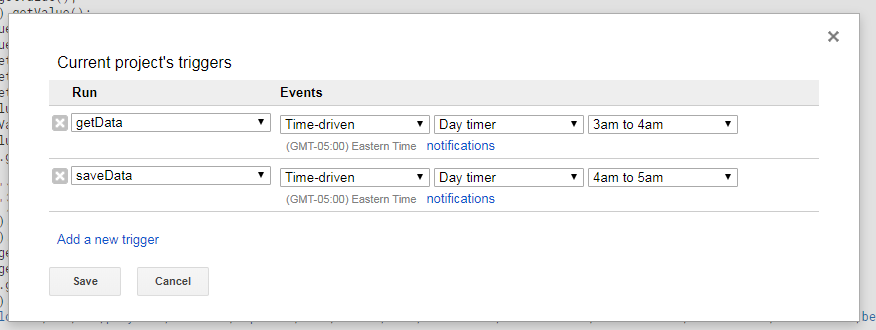
Still in your Script Editor, under the Edit Menu select Current Project Triggers. Here you can tell Google Sheets to run a function automatically based on a "tigger", for example, a certain time (monthly, weekly, daily, hourly, etc.). Note, I made sure to set my getData function to run before the saveData function.
The result? Each day I will have a nice data table that ran overnight with the updated NBA playoff picture.
Time to connect this worksheet to Tableau and get vizzing! I look forward to seeing how you use this function!
Thanks for reading. Questions? Feel free to reach out on Twitter @coreyj34. Corey
3 Comments
|
AuthorCorey Jones | @coreyj34 Archives
December 2018
Categories |


 RSS Feed
