Set Actions Part Two! In this example we use Set Actions to specify a date range. We will then use the set to highlight color and filter other graphs on the dashboard.
Tip 1: Highlighting a timeline using reference line 1) Create a calculated field based on the level of desired detailed for your timeline – in this case I used month and year: [Month / Year]: DATETRUNC('month', [Order Date]) 2) Create a set based on the new field above 3) Create a second calculated field keeping only the date values in the set: [Dates in Set]: IF [Date Set] Then [Month / Year] END 4) Add the new calculated field, Dates in Set, to the circle mark, to not break your path. 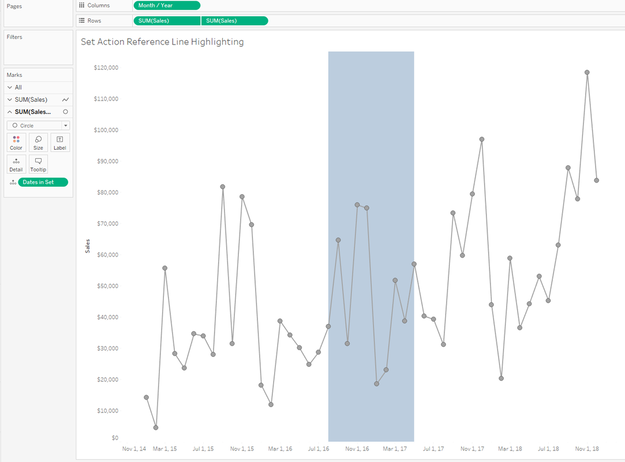
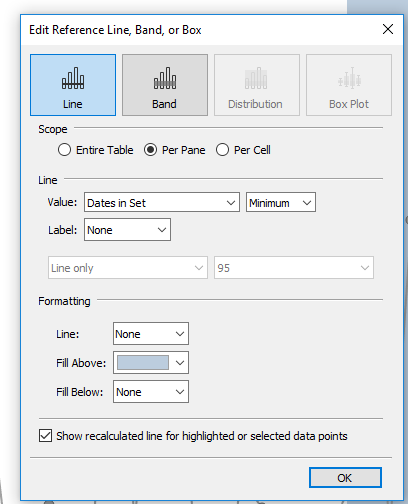
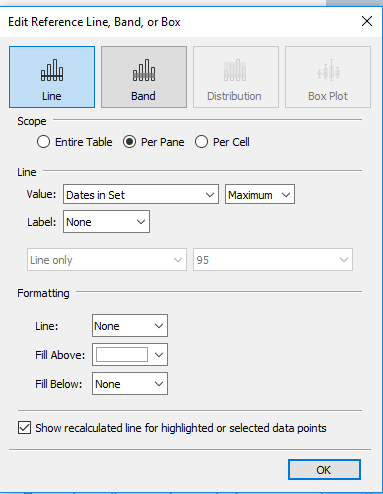
5) Add two reference lines: min(Dates in Set) and max(Dates in Set).
Color above the min reference line with a color, color above the max reference line to match the background (in this case, white).
Tip 2: Color bars based on values in the set
Simply the set (Date Set) to the color shelf 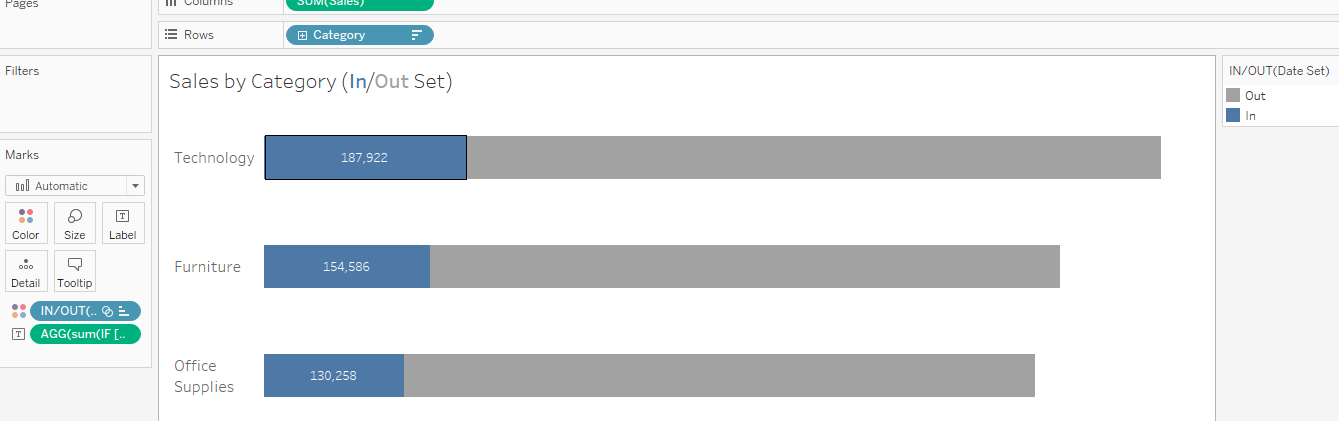
Tip 3: Filter based on values on a set
Drag the set to the filter menu to keep values “IN” set 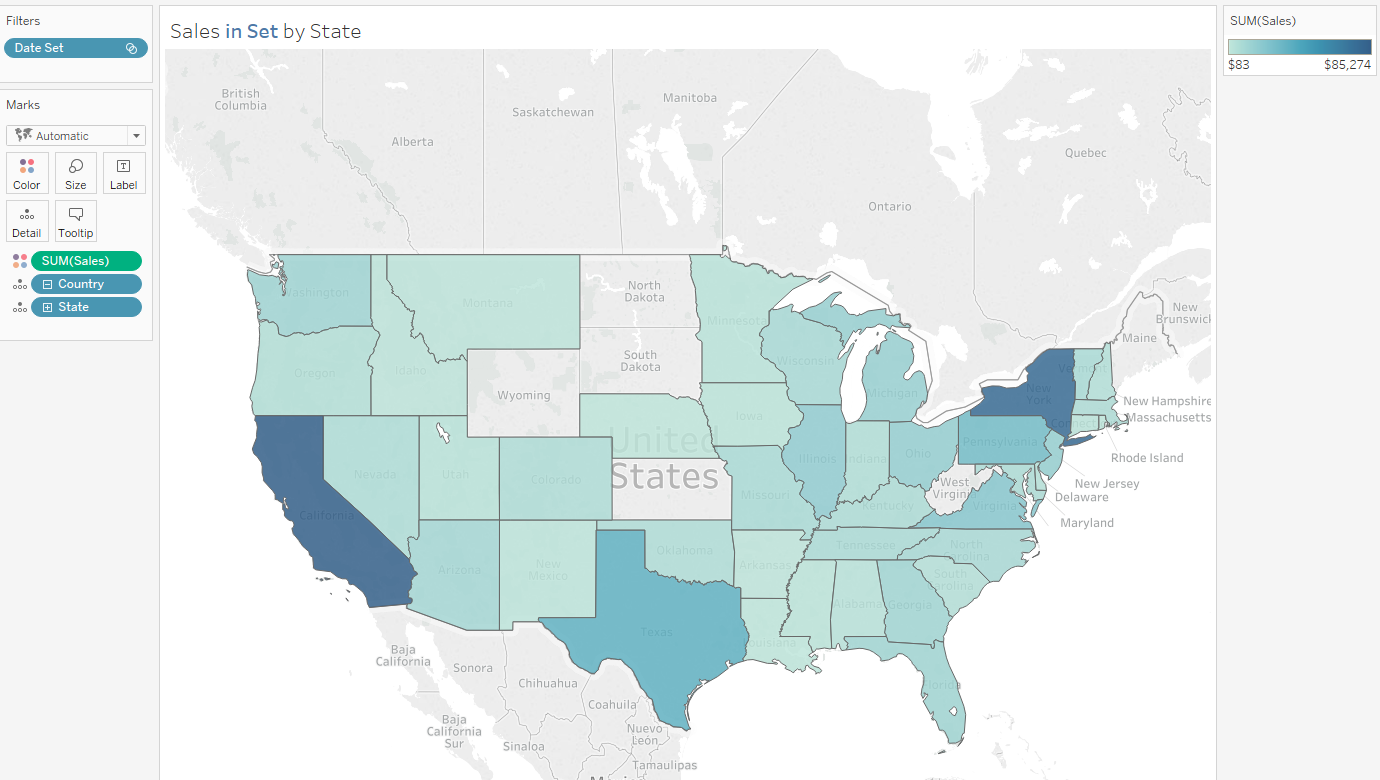
As you highlight new ranges of data on your timeline, your bars and map with update to represent the dates in your range. By using the option to Keep Set Actions, you can deselect you the marks on your timeline, and interact elsewhere on the dashboard, but your set range will remain – and your audience will know the range because the timeline stays shaded.
Thanks for reading – let me know if you have questions! 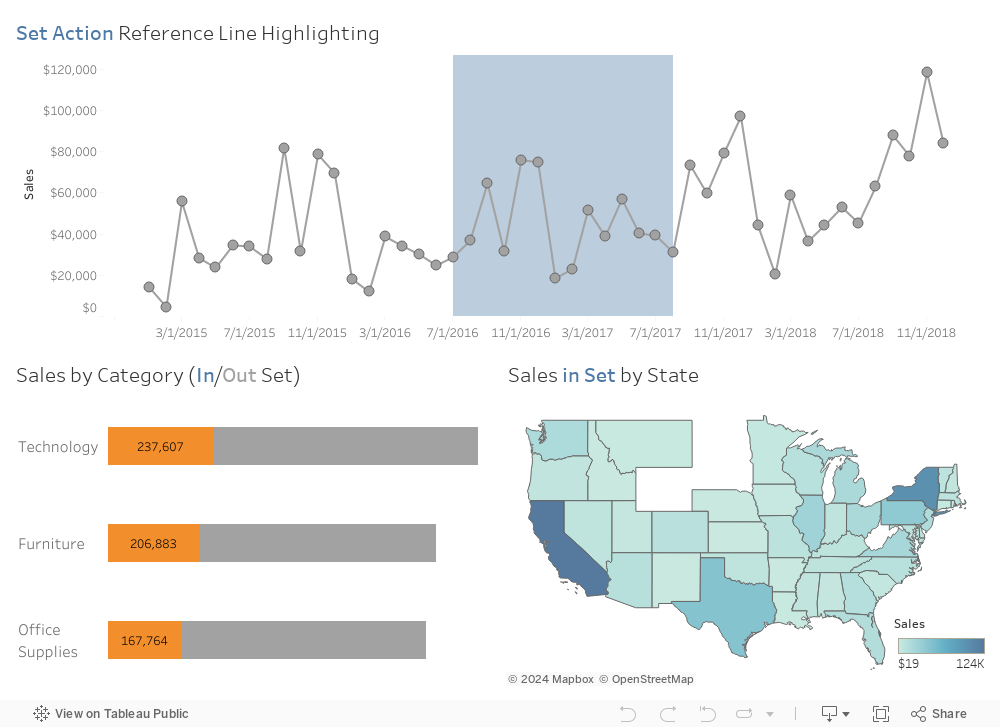
0 Comments
|
AuthorCorey Jones | @coreyj34 Archives
December 2018
Categories |
 RSS Feed
