|
Today, Lorna and I are excited to share with you our calendar of 12 #NationalDayProjects for 2019. As the days approach we will share the data sources we are using with you. We invite you to join us on our journey with our data or one you find yourself! 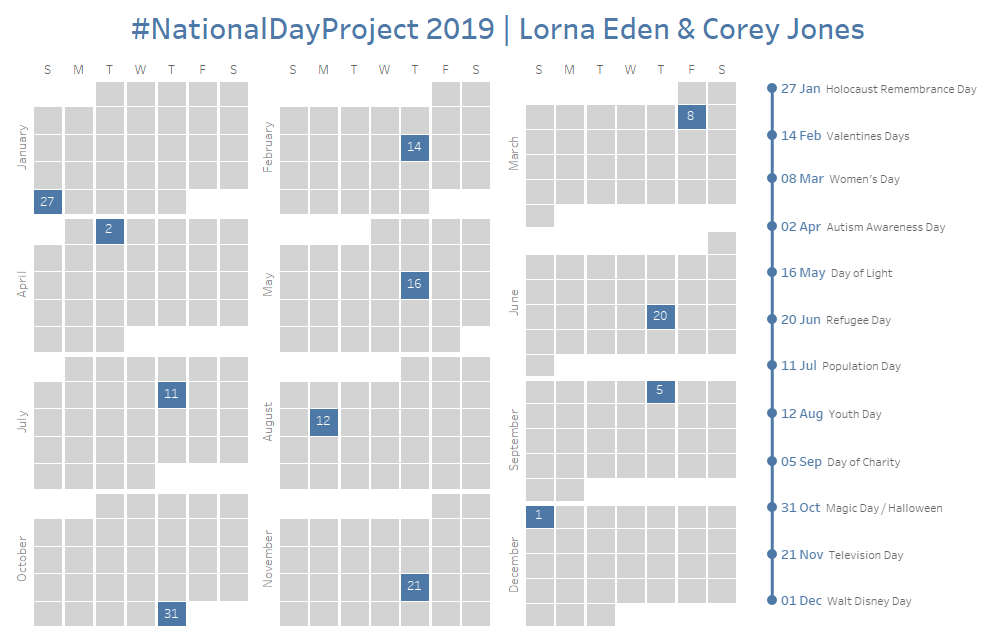
0 Comments
Our Favorite Dashboards of Each Other's WorkOur Favorite Dashboards from the CommunityYesterday Lorna and I shared with you some of our favorite Tableau tips. Today Lorna takes you through ten quick tips to make your cleaning your data a breeze with Tableau Prep: 1) You can Drag and Drop your files into your prep workflow
Late in the evening on day nine of #12DaysofTableau Lorna and I bring you nine quick Tableau tips. 1) Copy-Paste FormatIf you have multiple sheets that you want to have the same formatting (remove borders, gridlines, font size, etc.) you can simply right click on the formatted worksheet on the bottom pane and select copy format. Then right-click the sheet you want to copy the format to and select paste format. 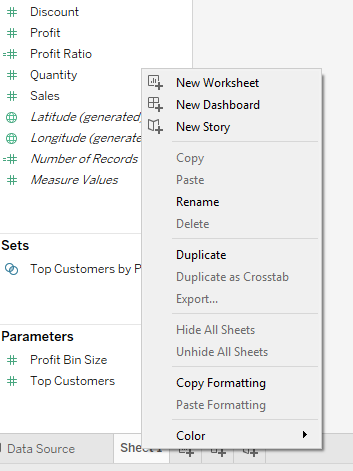 2) Spotting Custom Format + Reset to Default FormatWhen in the format pane, if you have changed something from the default, but you cannot remember what you changed, simply look for descriptions that are bold. Right click on the bold text and select Clear to reset to default. 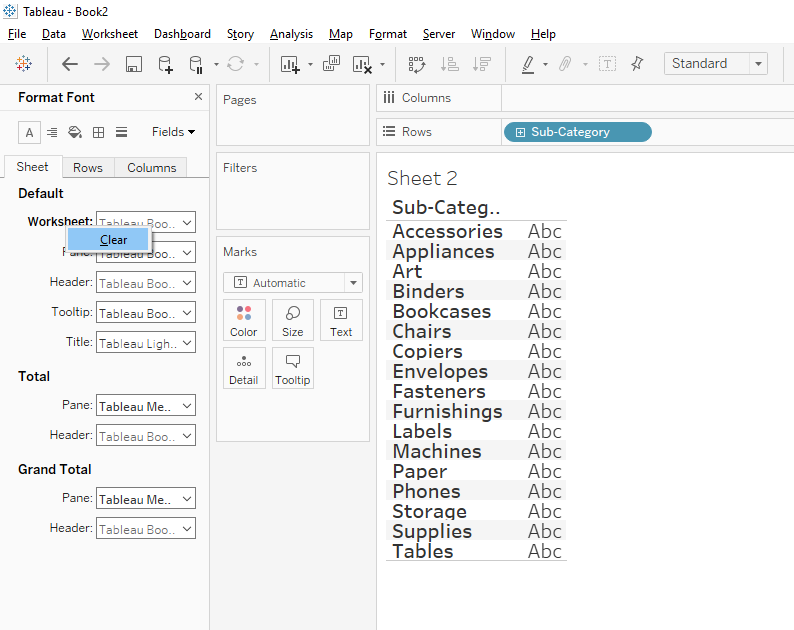 3) Preserve Formatting When Swapping FieldsRather than dragging a pill to replace a field, simply double click on the current pill in the rows/columns shelf, and within the pill type the new field. This will preserve any formatting changes and the sort:  4) Calculated Field ShortcutI love quick tips that save me time over time. One that checks this box for me is using the keyboard shortcut to create a new calculated field. The shortcut is ALT > A > C. While there are many shortcuts, this is one I picked up during Iron Viz and has become a habit. 5) Moving Discrete Headers to the Top Ever needed to have all your headers at the top, but theres always at least one at the bottom. If you go to Analysis, Table Layout, Advanced. Then Untick “Show innermost level at bottom of view when there is a vertical axis" 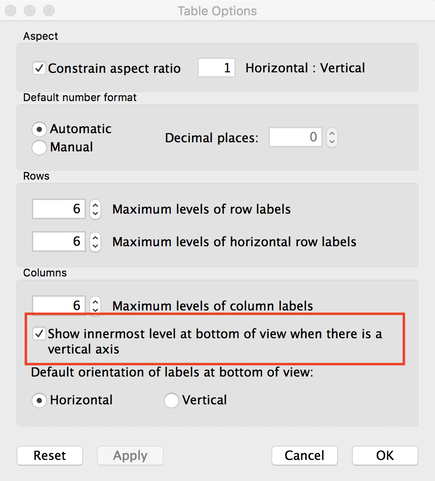 6) Using Dummy Fields for a Colour From Your Colour PalettesHave you ever wanted to use your corporate colour palettes or even the ones that Tableau have provided you, but you can’t when you don’t have dimension data. Well if you create a new calculated field called Colour and it just has ‘Colour’ inside. Add that to the colour marks card and then you can pick your colours. 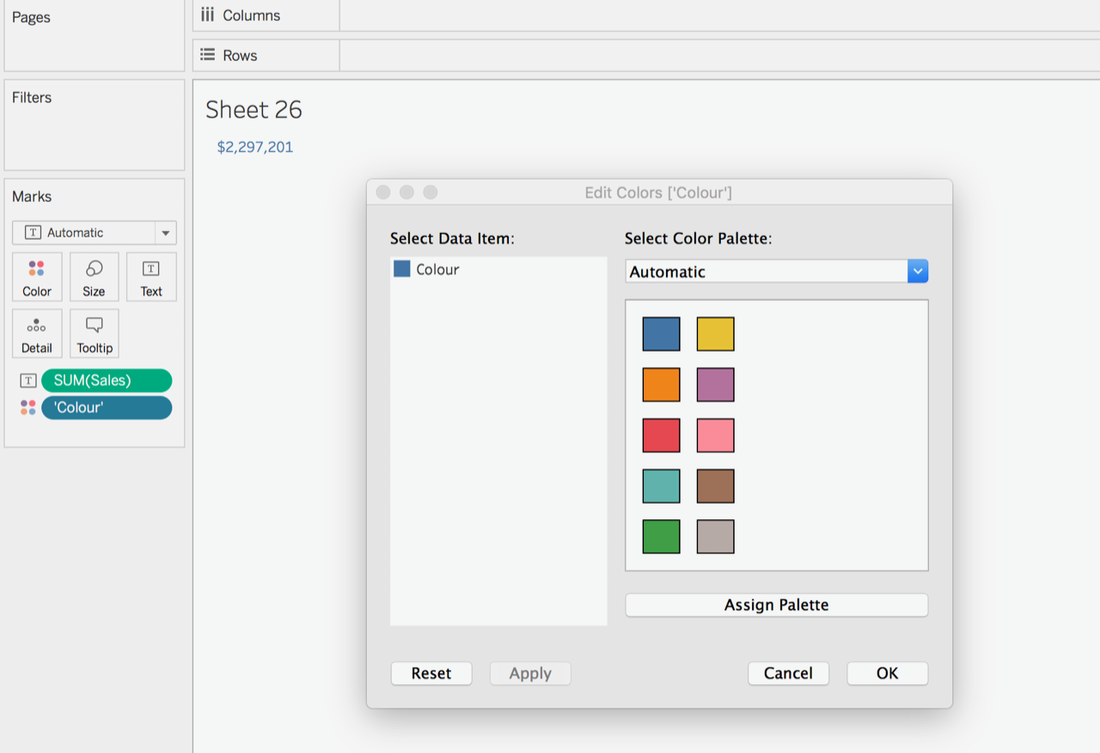 7) Describe Domain Ever wanted to know what was in a specific dimension but you always drag it into the view. If you right click on the dimension, click describe. It will then load a sample of the data and give you some examples of your dimensions. 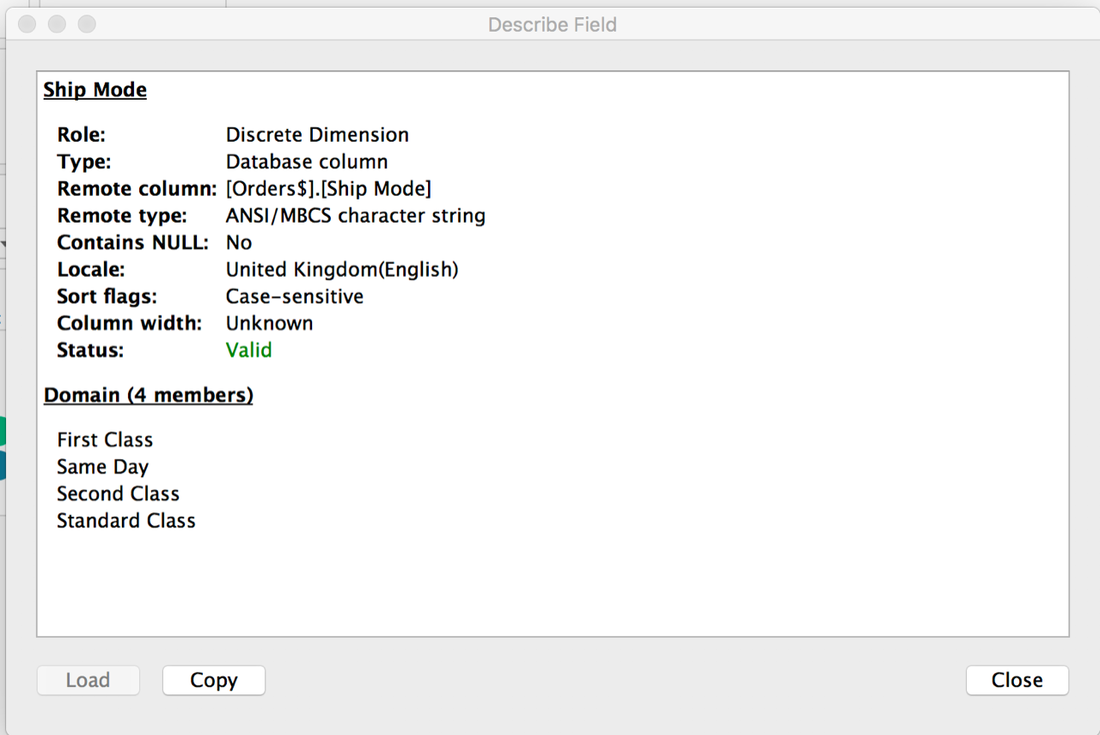 8) ButtonsI always used to use custom shapes as filters for navigation back and forward between dashboards. With the new button functionality you can add a custom button for navigation really easily. You can upload your own shape and add custom text on hover. 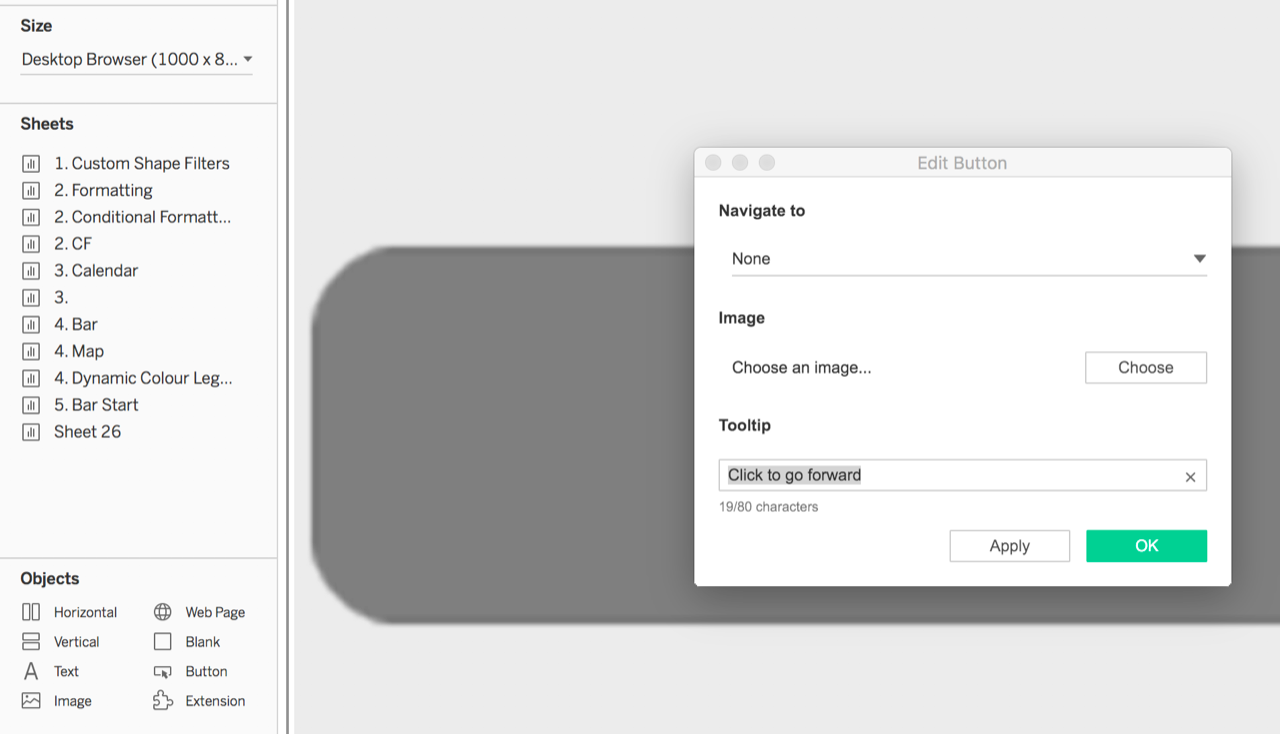 9) Formatting WHOLE WorkbookFrom version 10.2 Tableau has enabled you to format the workbook. This includes things like those pesky grind lines, axis rulers and tick marks, but in these options you can change the fonts for the whole workbook too. 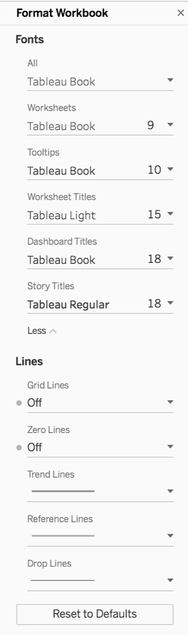 Today Lorna and I bring you eight of our most highly recommend Tableau Conference recordings for your viewing pleasure. 1 | Devs on Stage TableauDevs on Stage is one of my favorite sessions because you get a live look at many of the newest features to Tableau -- many not available yet to the public, and you get to hear directly from the devs who built their project! 2 | Live: Data Storytelling Ben Jones & Giorgia LupiEnjoy a candid interview between Ben and Giorgia as Giorgia shares her thoughts on data humanism, her approach to visualize data and perspective on her recent projects. 3 | Extending Tableau Front and Back Chris Demartini & Tamás FöldiHave you heard of Tableau Extensions? Are you interested in learning more about what is possible with this new feature? Look no further than Chris's and Tamas's presentation. 4 | Tableau Speed Tipping Ann Jackson & Lorna EdenWithout fear, Ann and Lorna challenge the record of Tableau Tipping royalty, Andy and Jeff, and attempt to share 100+ tips with the audience in 50 minutes or less. Will they reach their goal? The only way to find out is to watch, and I am sure you will learn a few things along the way. 5 | Achievement unlocked | From rookies to rock stars - building capability through gamification Fiona GordonFi’s session introduces the Tableau Quest, a gamification program to help people learn, keep them engaged, improve culture and coach them to build new skills. Learn how to level up! Layering training, challenges and certification with tips and tricks to motivate, collaborate, and most importantly - have fun! 6 | You are an artist | How and why to get started making public data visualizations Mike CisnerosMike title is exactly what he talks about. Why you should start vizzing in public. This session is super powerful and emotive. A day in the life of a data analyst | The data duo in action Adam Crahen & Pooja GandhiAdam and Pooja take it in turns to showcase how they deal with request and last minute changes in this role playing session! Freak-alytics | The hidden data behind everyday questions Rob Radburn & Chris LoveChris and Rob talk about how they come up with questions, the tools they use and how they create the visualisations.
|
AuthorWrite something about yourself. No need to be fancy, just an overview. ArchivesCategories |
 RSS Feed
